Allocate resources with confidence
Don't waste valuable time and money by misallocating council services. atlas.id provides a clear picture of the demographic demand for a range of services. Complex decisions are made simple.
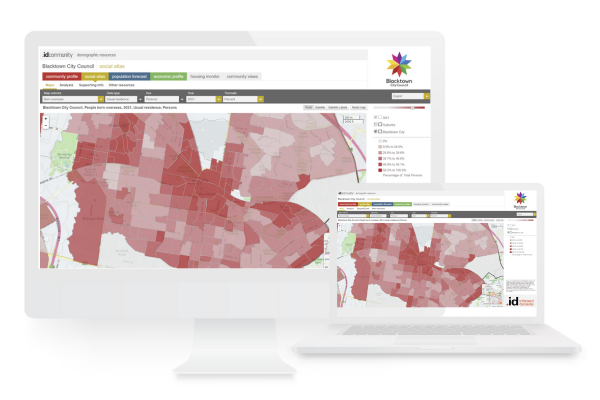
atlas.id presents a powerful suite of thematic maps to show where populations with specific characteristics are located, highlighting where services are required and identifying hidden pockets of need.

Don't waste valuable time and money by misallocating council services. atlas.id provides a clear picture of the demographic demand for a range of services. Complex decisions are made simple.
Spend less time number crunching and more time implementing strategies. Don't waste valuable research staff time or pay pricey consultants – atlas.id makes detailed catchment analysis data a few clicks away.

Demographic analysis at the LGA or even suburb level can miss groups of need, resulting in under-servicing the most disadvantaged. Using the smallest available geography no group is overlooked.

You shouldn't need to be a specialist to find the data you need. atlas.id's simple visual layout and curated content provides council and community the power to make informed decisions in their daily work.

Collaboration is core to the way we do business. Your subscription gives you direct support from the demographic experts behind the tool: from training and briefing sessions for executives, staff and the community to ad-hoc advice.

Empower community groups, local businesses and potential investors with the detailed data they need to make the best decisions. Save time by directing the public to your social atlas.
View the spatial distribution of various groups with more than 80 themed maps. These maps are curated based on our work with Local Government ensuring you have all the data you need to make confident, informed decisions.
Demographic analysis tells a very different story at different levels of geography. Planning local service delivery requires analysing demographic data at the smallest possible geography. atlas.id's deceptively simple visualisation brings different area's needs to light.
Understand the demographic make up and service requirements of custom catchment; just select your areas and demographic features of interest. Data is fully exportable for further analysis.
Choose a demographic theme and select the "change" option for a visual map of how small areas across your LGA are changing.
All of .id's information tools are made publicly available, providing shared evidence base across Council, local business and organisations, and the wider community.


Are your services getting to those most in need? Understand the geographic spread of need for services across your LGA by visualising the relevant demographic data on a detailed map.

Identify the need for new services or profile groups around a new development using straightforward catchment-analysis techniques.

Empower local businesses and potential investors by giving them the data and tools they need to make the right investments.

Enhance funding applications and similar activities with simple to consume visualisations of local needs and challenges.

Get new staff and councillors up-to-speed with local issues and challenges by allowing them to explore how your area differs geographically across a range of themes.