POPULATION FORECAST REVIEW

Ipswich Region, Queensland

A favourable economic outlook, protection from the population impacts of pandemic and an abundance of greenfield and higher-density housing supply combines to make Ipswich the fastest-growing region in Queensland over the next 20 years, according to our latest forecasts.

Get the data

Purchase a one-off forecast report for a custom catchment that fits your project or contact our team for a quote to access the complete dataset.

SELF-SERVE REPORT COMPLETE DATASET

Here are the five key findings of our forecasts for the Ipswich region. Read our full analysis below for a more in-depth discussion of each.

  1. Ipswich will add more people than any other region in Queensland in the next 20 years
  2. The major growth areas are Ripley and Springfield
  3. An increasing share of the population will start to live in higher-density dwellings in the next ten years
  4. Ipswich will continue to grow to accommodate the outward expansion of Brisbane
  5. Ipswich will not be as heavily impacted as regions like Brisbane City and the Gold Coast by the population impacts of the pandemic. 


Forecast intervals Single years 2016 to 2041
Data available Population (total and by single-year-of-age)
Dwellings
Geography Proprietory SAFi geography, providing more granular forecast detail in growth areas.
Forecast version 4.0.0
Release date April 2022
Formats .csv, spatial file


Contact our team here for a quote to access the forecast data, as an entire dataset or for a custom catchment for a specific project.

Every region has unique characteristics that impact the size, age and distribution of the population. Here are some things to keep in mind about the Ipswich region.

Five local government areas, five planning schemes

Future development in the Ipswich region is governed by five local government areas, each with its own planning controls. As the location and timing of this development heavily influences the way the population is distributed within a region, we've considered how these different codes impact the timing of development on available land (both greenfield and developed) in each of these areas. 

Geographic detail in growth areas

The statistical geography created by the ABS is designed to show an appropriate level of detail about the characteristics of today's population. As forecasters, we're often looking at places that are currently paddocks or bushland but are forecast to be home to thousands of people. This is why we create our own boundaries for these places, to help you understand how the population of future growth areas will be distributed.

Menu

The insights and analysis behind our forecasts of population and dwellings for Ipswich, Queensland.


Top-down

How the big picture stories will impact the future population of Ipswich.

Bottom-up

How available housing and planned development are forecast to distribute the population across the region.

Ipswich SA4 with LGA boundaries-1

place government parliment_Block_ORANGE

Resources for local government

Ipswich is both a Local Government Area (LGA) and a Region (SA4) in South East Queensland. We work extensively with the five councils that are part of the Ipswich region and provide publicly-accessible information tools for the Brisbane, Ipswich, Logan, Lockyer Valley and  Scenic Rim local government areas. 
 
Our population forecasts for local government reflect local planning policy and are an important advocacy tool for the impacts of population growth, infrastructure requirements, and services planning. For more information about forecast.id and the role it plays for local councils, you can read more and contact our team here.

Commentary and analysis from our specialist team of population forecasters.

Meet the full team →

Johnny Barnard

Johnny Barnard

Population forecasting lead
Darren Thomas

Darren Thomas

Land use and development site research
john-o

John O'Leary

Forecast modelling

map -catchment-280

Defining 'Regions'

The way we define places is fundamental to our forecasting process and to understanding the nuances of and interrelationships between places. In this review we use Region interchangeably with the technical term Statistical Area 4 or SA4. SA4s are designed by the ABS to represent labour markets and functional areas of Australia. You can read more about how SA4s are defined on the ABS website here.

From the top-down

How the big-picture stories will impact the future population of Ipswich

Before we started work forecasting in Ipswich, we completed a series of 'Top-down' forecasts.

  • National forecasts (How is the total population of Australia forecast to change?)
  • State and territory forecasts (What share of that growth will go to each State and Territory?)
  • State-to-SA4 forecasts (What share of the state's growth will go to each region of Queensland?

This 'top down' process ensures our forecasts for Ipswich consider what's happening in other regions, states and territories, and account for the role and function of Ipswich within this context. Our bottom-up process then distributes the total forecast population for Ipswich by matching people in households to available dwellings.

In our Queensland after Covid webinar, we discuss how favourable economic conditions, including a burgeoning renewables industry, defence spending and the 2032 Olympics informed our top-down forecasts for Queensland and its regions. 

Click here to watch our Queensland after Covid webinar on demand.

Why we've forecast Ipswich to be the fastest-growing region in Queensland 

Our forecasts show Ipswich adding 260,679 people over the 20 years 2021 to 2041. This is a 69% increase in its 2021 population, making it the fastest-growing region of Queensland and representing 20% of the total growth in that state over the forecast period.

Our decision to forecast this growth in the Southern and South-Western growth corridors of Greater Brisbane is based on a few factors.

Identified priority growth areas

The Ripley Valley, along with Yarrabilba and Greater Flagstone in the neighbouring Logan region, has been identified as a Priority Development Area by the Queensland Department of State Development, Infrastructure Local Government and Planning. Furthermore, the Springfield Structure Plan provides planning controls for that growth front. 

Slow down of dwelling supply in the northern regions

As growth areas in the Moreton Bay North region start to reach capacity, we've given a greater share of forecast growth to Ipswich, Logan, and the Gold Coast.

Available land supply

The Ipswich and Logan regions, in particular, have significant capacity for additional development, compared with Brisbane City, which has limited land available for development (and is therefore where most of Ipswich's growth is forecast to come from).


The role and function of Ipswich

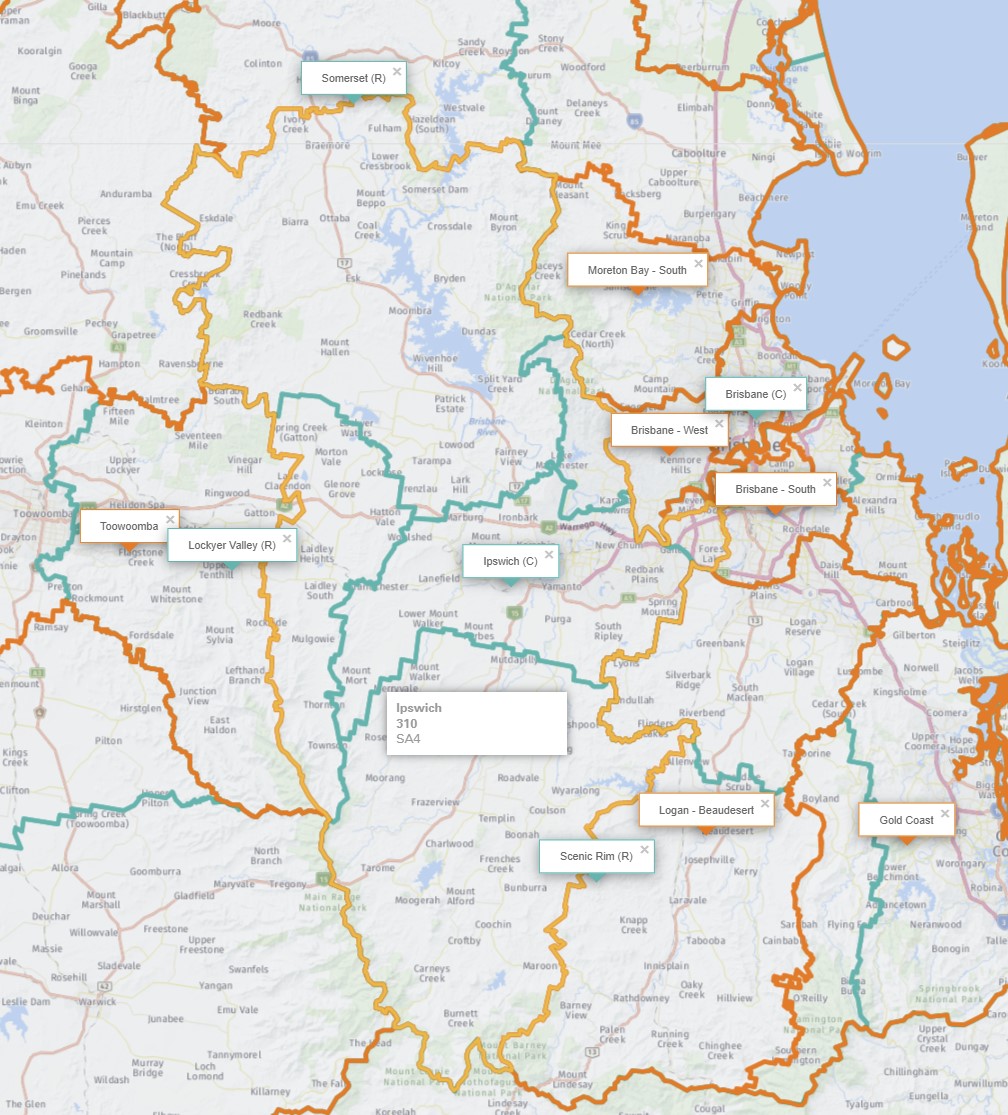
As a region of Greater Brisbane, Ipswich is enormous, spanning over 100 kilometres from Somerset Dam and Esk in the North to Mount Barney and the Scenic Rim in the South. The area encompasses a wide variety of housing markets and population densities. So while it’s not useful to characterise the region as a whole, understanding the role and function of growth areas within Ipswich is a good way to explain how demographic forces will influence the population of Ipswich.

Avoiding the brunt of the pandemic's population impacts

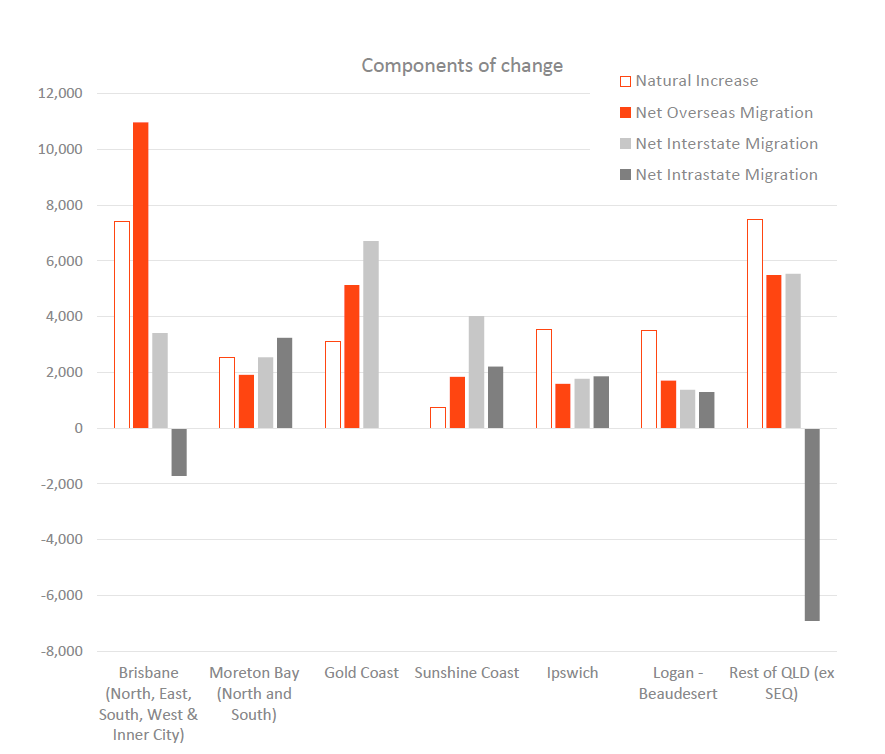
Ipswich, along with the neighbouring Logan-Beaudesert region, services the outward expansion of suburban Brisbane, which is limited in terms of its capacity for additional housing supply. The most significant driver of population growth in Ipswich is intra-state migration - mostly the outward expansion from the South and South-Western suburbs of Brisbane City. While Ipswich does get some growth from overseas migration, and our forecasts reflect this in the total forecast for the region (SA4) and the different areas within (SA2s), you can see in the chart below it doesn't rely on overseas migration anywhere near as much as the Gold Coast, which will be much more significantly impacted by the population effects of the pandemic.

Economic self-containment and the link with Brisbane

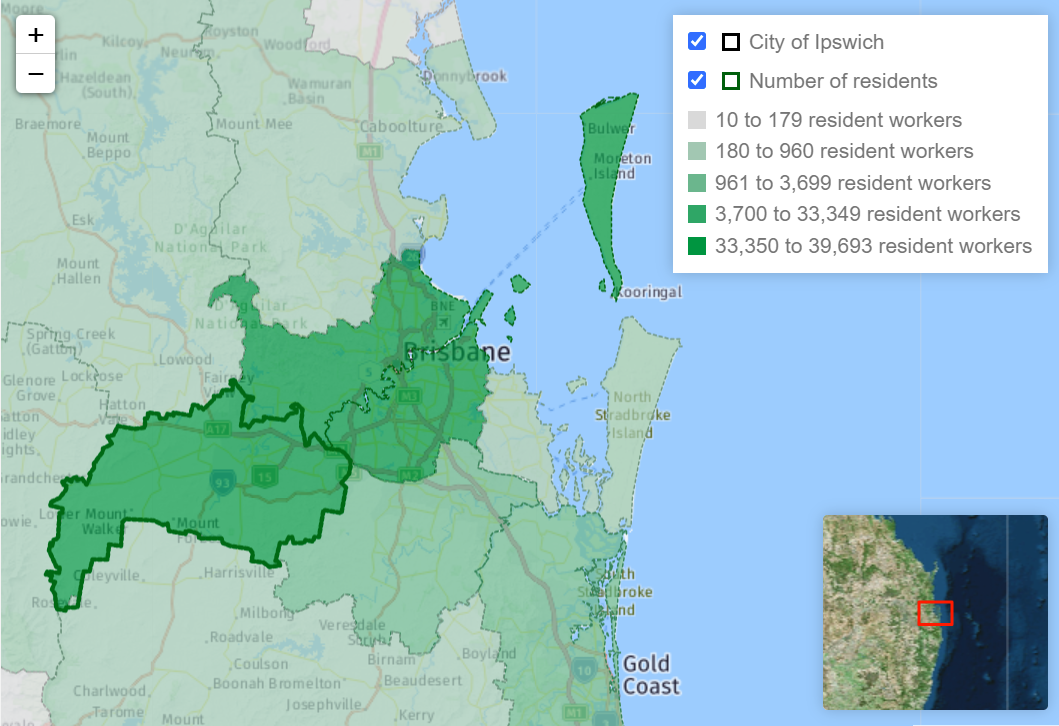
While the City of Ipswich is only one of five LGAs in and around the Ipswich region, it includes the significant growth areas of Ripley and Springfield. As at the last Census, 47% of the City's resident workers were employed locally, making it more self-contained than neighbouring Logan City, where only 40% of residents work locally. 40% of the remaining employed residents commute to Brisbane, but only 6% of all the city’s employed residents travel to work by train.

Economic self-containment in the City of Ipswich


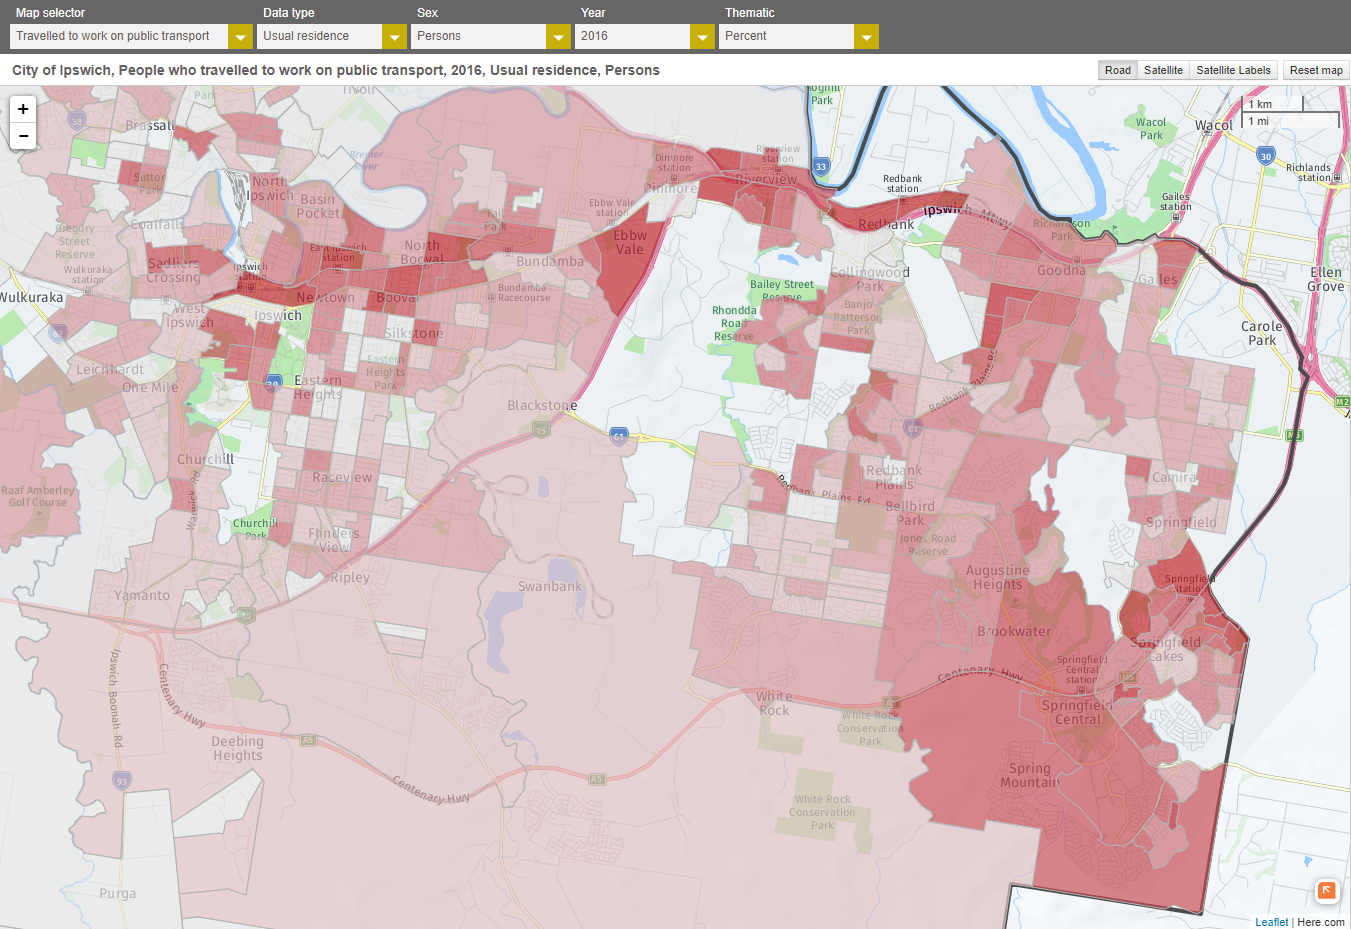
These people are clustered, as you might expect, around the Ipswich and Springfield train lines. A proposal to build a 25-kilometre rail line from Springfield Central to Ipswich Central would complete the loop and service the Ripley growth area. Support for such infrastructure projects is one of the things we consider when we make the assumption that there will be an increase in the number of higher-density dwellings being constructed and the proportion of the population living in them.

City of Ipswich, People who travelled to work on public transport, 2016

Untitled-Mar-31-2022-10-17-27-97-AM

Household type- Couples with children Orange-Block-

Constraining growth (every developer can't be right)

Perhaps the most important thing about our top-down forecast model is it quantifies the demand for housing in an area, and in doing so, provides a constraint for the growth expected in a given area.

The purpose of our bottom-up research is to distribute the ‘target’ population across the hundreds of small areas that make up a region. To do this, we conduct in-depth research to identify the timing, location and sequence of significant sources of new dwellings.  Our forecasters then make decisions to match the forecast population with the forecast supply of dwellings. In most cases, not all planned development is used. 

This information is available either as evidence of our forecast assumptions or as a stand-alone forecast of residential development. Learn more here or contact our team for more information.
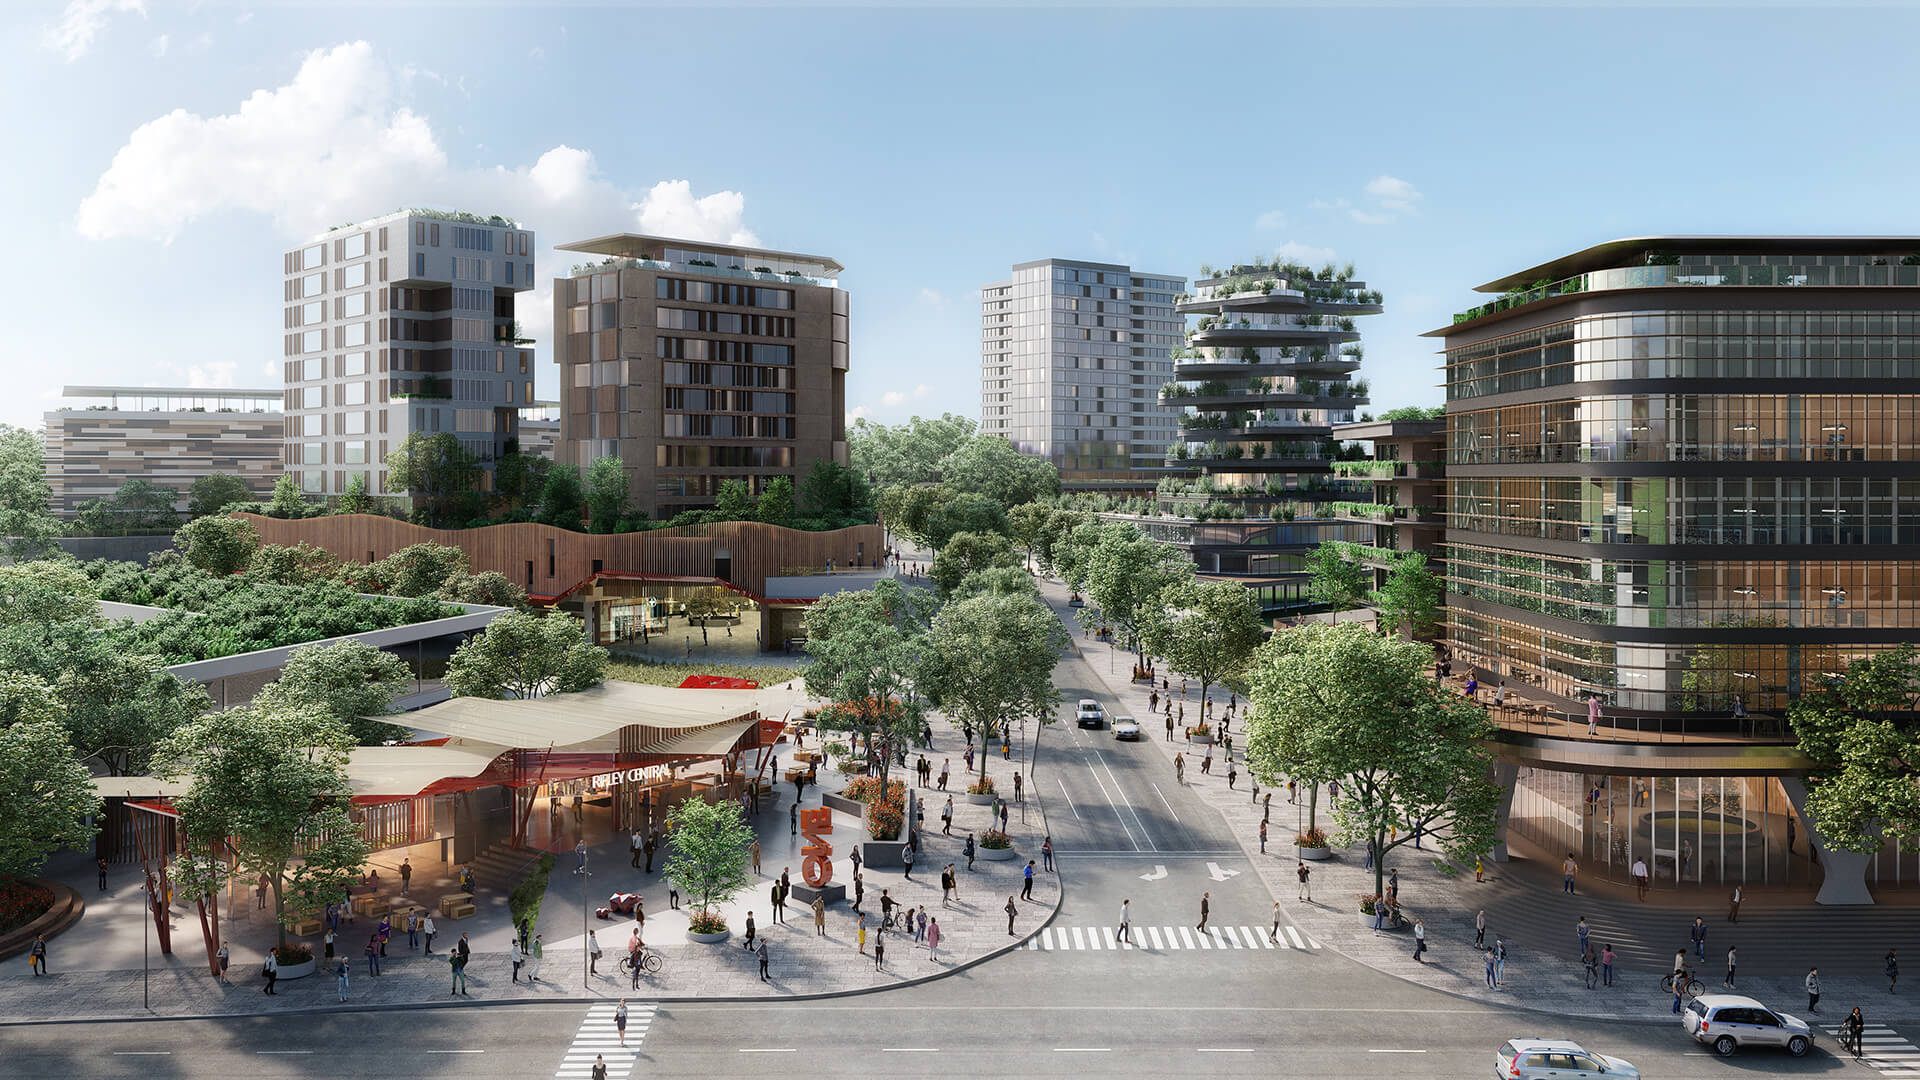
From the bottom-up

What we know about local areas informs how we distribute population across the region

At the local level, the number and type of dwellings available determine where people of different age groups and household formations live within a region.

This is why we conduct detailed research using a range of sources to understand land use policy and both current and planned residential development activity to inform our micro-geography forecasts.


urban.com.au Nearmap Cordell Queensland treasury OpenLot.com.au Brisbane development Development-ready Callpoint spatial City of Gold Coast-1 Scenic Rim regional council Realestate.com.au

An abundance of supply

Our forecasters allocate the forecast population across many different development sites in Ipswich. There are both  greenfield and higher-density sites in major growth fronts like Springfield and Ripley, but there will also be housing capacity from densification (in-fill) in established areas like  Redbank Plains. And that’s just within 10 kilometres of the Ipswich town centre. There are also established areas like Wolloon, Thagoona and Rosewood out along the train line, plus localities such as Boonah, in other parts of the region, that will all take a share of the forecast growth.


Why we're forecasting growth in the number of people living in apartments in Ipswich

By 2026, we're expecting to see evidence of more people living in apartments, particularly around the Ripley and Springfield activity centres. This represents a paradigm shift in housing for which there isn't currently much evidence on the ground, and only a few precedents in other parts of the country, such as Western Sydney.

This is an important assumption in our forecasts for Ipswich, as it affects how the total forecast population is distributed within the region (if these apartments are built and people choose to live in them, more people will live around these activity centres rather than being spread across other places in the region.

Ripley

The SA2 of Ripley includes the localities of Ripley, Ripley South, Deebing Heights, Swanbank, White Rock and Spring Mountain. Together, our forecasts have these areas adding 97,000 people by 2041, accounting for one-third of all the forecast population growth for the entire Ipswich region over the next 20 years. Even so, we're still slightly more conservative in our growth forecasts than many developers.

The Ripley Valley is a Priority Development Area (PDA), with a number of developers including Stockland, Sekisui House, AV Jennings, Satterley, Monterea and Goldfields all advertising new developments in the area.

We have identified 40,000 potential dwellings in the Ripley SA2, each at various stages of development. We assess and sequence each of these sites to inform our view of the timing, location, and sequencing of housing supply. Our forecasters then match these dwellings to the forecast population.

Surprisingly, the ABS has not divided the Ripley SA2 with the new 2021 Census geographies, so it will remain one of the largest SA2s covered by our National Forecasting Program. For anyone making decisions about where to locate businesses or forecasting demand for services, a much more granular view of the future population is necessary - even the SA1s within those SA2s don't provide adequate detail. Johnny's video below explains why (and how) we divide up these SA1s into micro-geography forecast areas for our forecast outputs.

What we're monitoring in Ripley

  • The rate of construction and occupancy of higher-density dwellings (apartments)
  • A proposed train line extension from Springfield to Ipswich that would service the Ripley Town Centre

Opposite: Artist's impression of Ripley Town Centre (Sekisui House)

Ripley Town Centre

Springfield

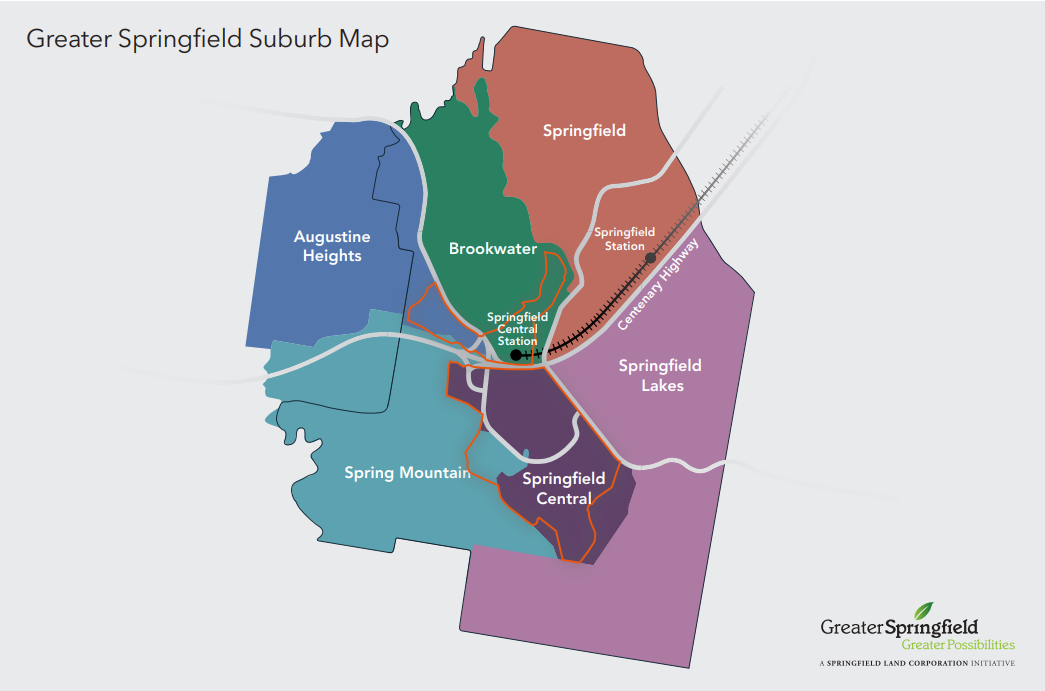
Established in 1992, Springfield is a master-planned community that has been a significant growth area for the past 30 years and is now an established area. 'Greater Springfield' covers the Springfield, Springfield Lakes, and the Bellbird Park-Brookwater SA2s - three of the top ten areas driving growth in the Ipswich region in our table above. Combined, these areas account for 28% of the forecast growth in Ipswich by 2041. 

The Aveo Springfield retirement village and the Education City Residential Village that's part of the University of Southern Queensland campus both have interesting implications for the age structure of the population in these communities. 

As in Ripley, we will be monitoring how many people choose to live in higher-density dwellings around Springfield Central. Our development site research has 10,000 apartments identified in the area to the North of the train station alone. Our top-down model demands that these higher-density sites be used to accommodate the population we have forecast for the region, but it's one we'll be watching closely, as these apartments haven't been built yet, and the next few years will reveal the extent to which the market supports this paradigm shift in housing, especially considering there will be a steady supply of more traditional detached housing in greenfield sites nearby for much of the forecast period.

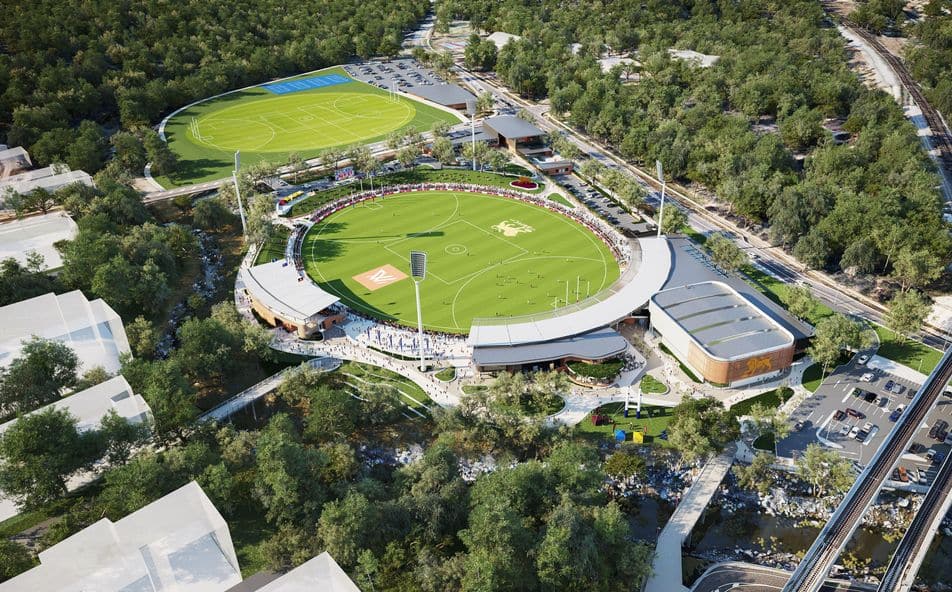
Opposite: The Brisbane Lions' new administrative facility and AFLW home ground adjoins Springfield Central station at The Reserve, Springfield

Brisbane Lions AFLW home ground in Springfield, Queensland

The Greater Springfield suburb map

Greater Springfield suburb map

(Greater Springfield Town Centre concept plan)

Greater Springfield forecast areas

Greater Springfield forecast areas

Source: .id Placemaker

Our micro-geography forecast output breaks the Greater Springfield area down into 53 forecast small areas. 

Remnant supply in established areas (large site intensification)

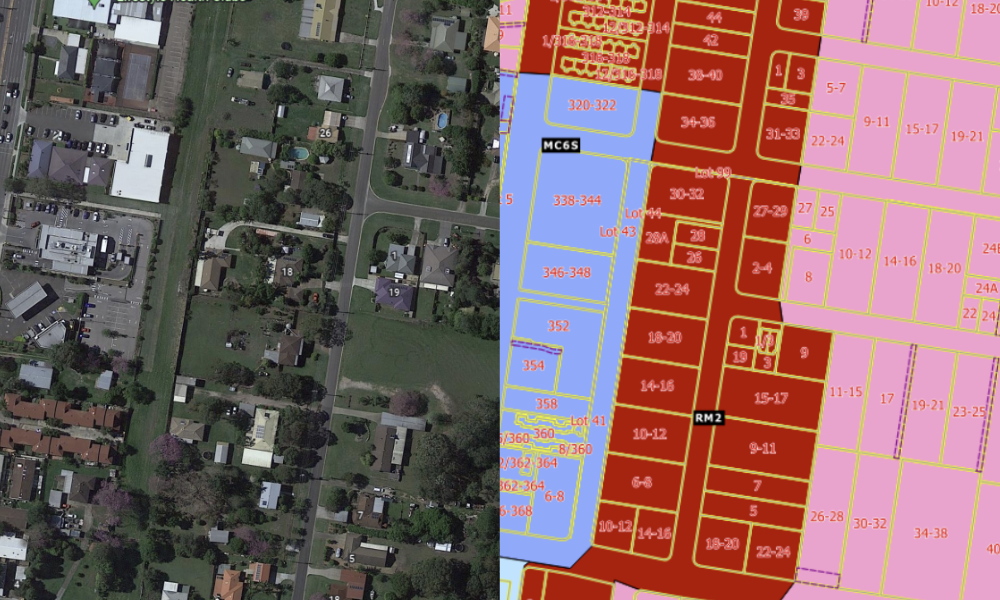
In some of the older parts of Ipswich (within the Redbank Plains and Bellbird Park SA2s), there are many examples of large-lot residential land (many are 1-acre blocks) that are zoned for higher densities.

In recent years, a number of these large properties have been turned over and now have 10-15 dwellings on them. We have therefore included these large-lot sites as another source of dwellings that we expect to become available in the forecast period and therefore influence the distribution of the population within the region.

Residential in-fill

Similarly, we forecast a rate of infill that will occur in established parts of Ipswich where lower-density dwellings (standalone homes) are expected to be converted to dual occupancy and four-or-six apartments on a single site. Any sites that are forecast to add over 10 dwellings are captured within the development forecasts outlined above. 

Opposite: An example of a street of very low density lots in an area zoned for 2-storey medium residential development (Ipswich City Planning Scheme)

In-fill sites, Ipswich-1

Growth in smaller localities

With two large development fronts dominating growth in Ipswich, how do we account for growth in other parts of the region?

The towns of Walloon, Thagoona and Rosewood are all suburbs along the suburban rail line from Brisbane and service a slightly different housing market (the median house price in Augustine Heights, a suburb of Springfield, is $625,000, compared with $445,000 for Walloon). With plenty of appropriately zoned land and development activity occurring in the past three years, we have assumed these areas will continue to grow at about the same rate they have been in recent years.

We've applied a similar logic to other localities and rural townships including Laidley, Lowood, Fernvale, Esk, Kilcoy and Boonah. 

How we provide more geographic detail in growth areas

When you're dealing with Census data, SA1-level data is generally considered quite a granular view of the population. However, as SA1s are designed for the current population, they're often not as useful when it comes to population forecasts for Growth areas. 

Johnny explains how we overcome this issue, by developing our own micro-geographic areas to provide greater detail for anyone planning businesses, infrastructure or services for growth areas.


Your questions answered

Do you have a question about our forecasts, our assumptions or about the Ipswich region? You can submit a question to our team by emailing locationdecisions@id.com.au

Request a copy of our forecast data for the Ipswich region.