Updated data: JobSeeker figures for August 2020 added. See an example.
More about the housing.id updates
The Housing Monitor (housing.id) continues to evolve in consultation with our local council clients. The ongoing goal is to create the most effective tool for councils to plan, deliver and monitor the supply of affordable and appropriate housing for their communities.
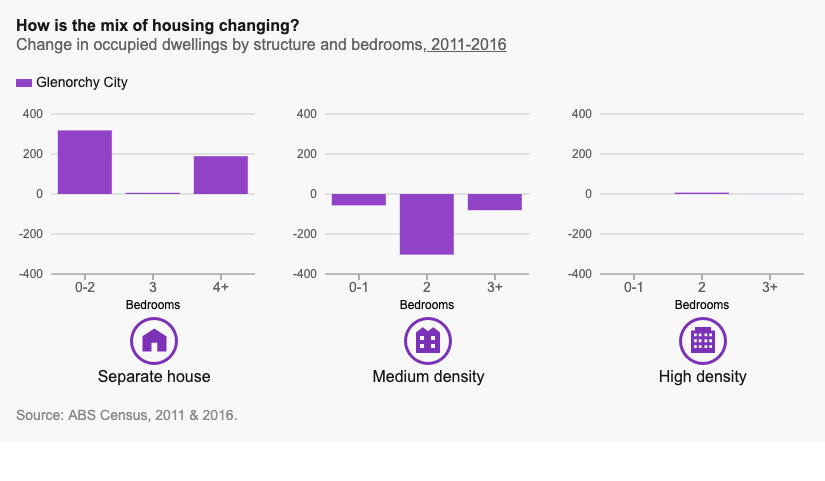
How is the mix of housing changing?
This new chart on the Housing and approvals page tells the story of the emerging types of dwelling stock in the area, as well as who lives in them. It displays the change in occupied dwellings by structure and bedrooms over the two past Census.
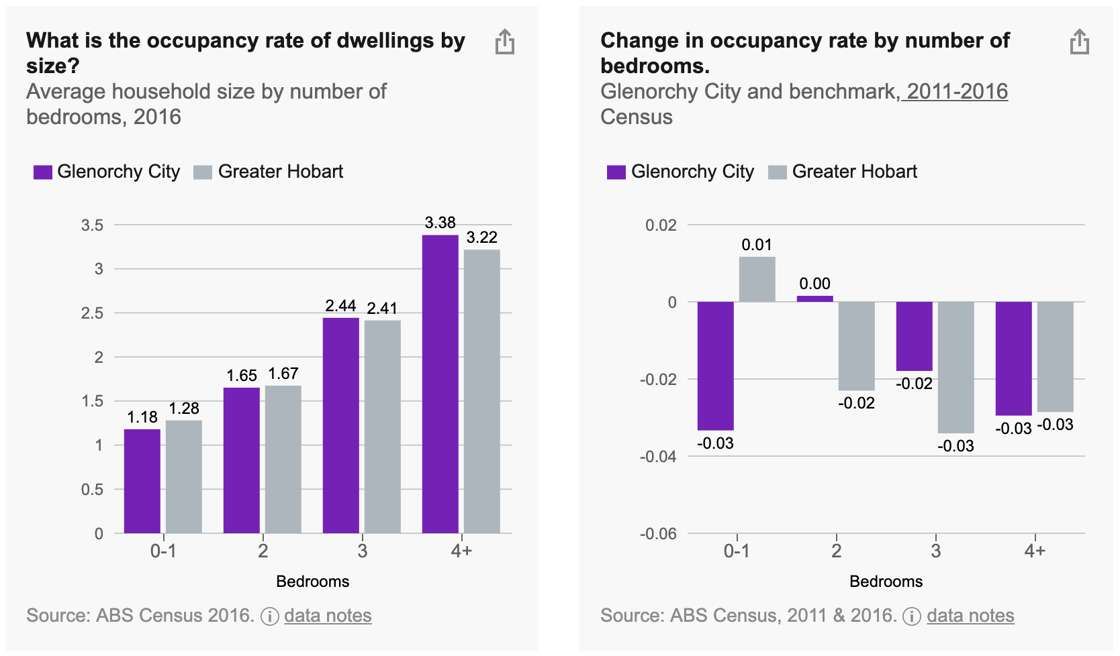
What is the occupancy rate by dwelling size? How is that changing?
Two new sets of data on the Housing consumption page tell the story of how many people live in different size dwellings, and how that is changing. This relates to the changing consumption of housing by different household types. Are families increasingly occupying smaller dwellings, while family homes have decreasing occupancy due to ageing empty nesters? How does the number of persons in each dwelling type reflect the availability of housing stock in the area, relative to the wider region?
Improved navigation menus
In response to feedback from our users, we've improved the navigation of pages on the Housing Monitor. Sub-menus on the left-hand side of each page allow you to move easily between topics.
More about the community.id update
August 2020 data for JobSeeker and Youth Allowance recipients has just been released by the Department of Social Services and added to Community Profile's new JobSeeker page.
Glenn Capuano
Demographic consultant | Team community .id - the population experts